
Linear Regression
Linear Regression: Overview
This Topic covers sub-topics such as Correlation, Correlation Coefficient, Scatter Diagrams, Method of Least Squares, Co-variance, Types of Correlation, Simple Linear Regression, Correlation Analysis, Positive Correlation and, Negative Correlation
Important Questions on Linear Regression
Find the value of at , given some set of values .
Consider the value of and line of best fit together with their definitions to your answer. All the original -values are increased by adding and all the original -values are decreased by subtracting if a set of bivariate data has a Pearson product moment correlation coefficient of for pairs . The on line of best fit is given by .
State the new value of
State the new value for the gradient of the on line of best fit.
When the gradient of the regression line is positive, the correlation is strong. State whether the given statement is true or false.
Explain perfect positive correlation with a scatter plot.
Explain the importance and significance of correlation.
State the types of correlation.
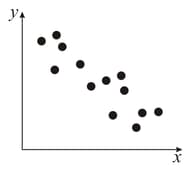
The following graph has
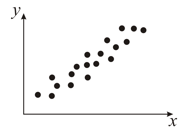
The following graph has
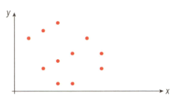
Determine the value of correlation coefficient for the scatter diagram given below.
Identify the type of correlation between the weight and income of individuals.
Bivariate statistics compare three variables.
Define bivariate statistics.
Find the equation of least-squares regression line from the given data.
and
Find the equation of least-squares regression line from the given data.
and
If , , , ,, , then find the regression equation of on .
Identify if the following data is Univariate data or Bivariate data
Traffic accidents along with the weather on a particular day
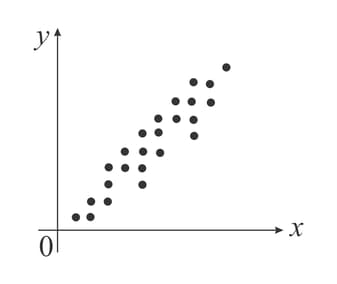
Interpret the scatter diagram given below and describe whether the diagram shows strong/weak/no correlation. If the variables are correlated, describe the correlation using the words positive/negative; linear/non-linear.
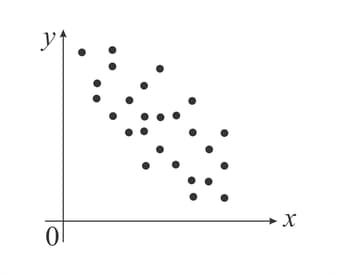
Interpret the scatter diagram given below and describe whether the diagram shows strong/weak/no correlation. If the variables are correlated, describe the correlation using the words positive/negative; linear/non-linear.
Identify if the following data is Univariate data or Bivariate data
Ice cream sales compared to the temperature that day
Segmented linear regression is segmented regression whereby the relations in the intervals are obtained by _____.


